Data project · Solo: data engineering, modeling, dashboard, and writeup
NYC District 2 Elementary Enrollment Forecasting
Bounded scenarios beat a single ML default by 2x MAPE, measured against the actuals that came out later.
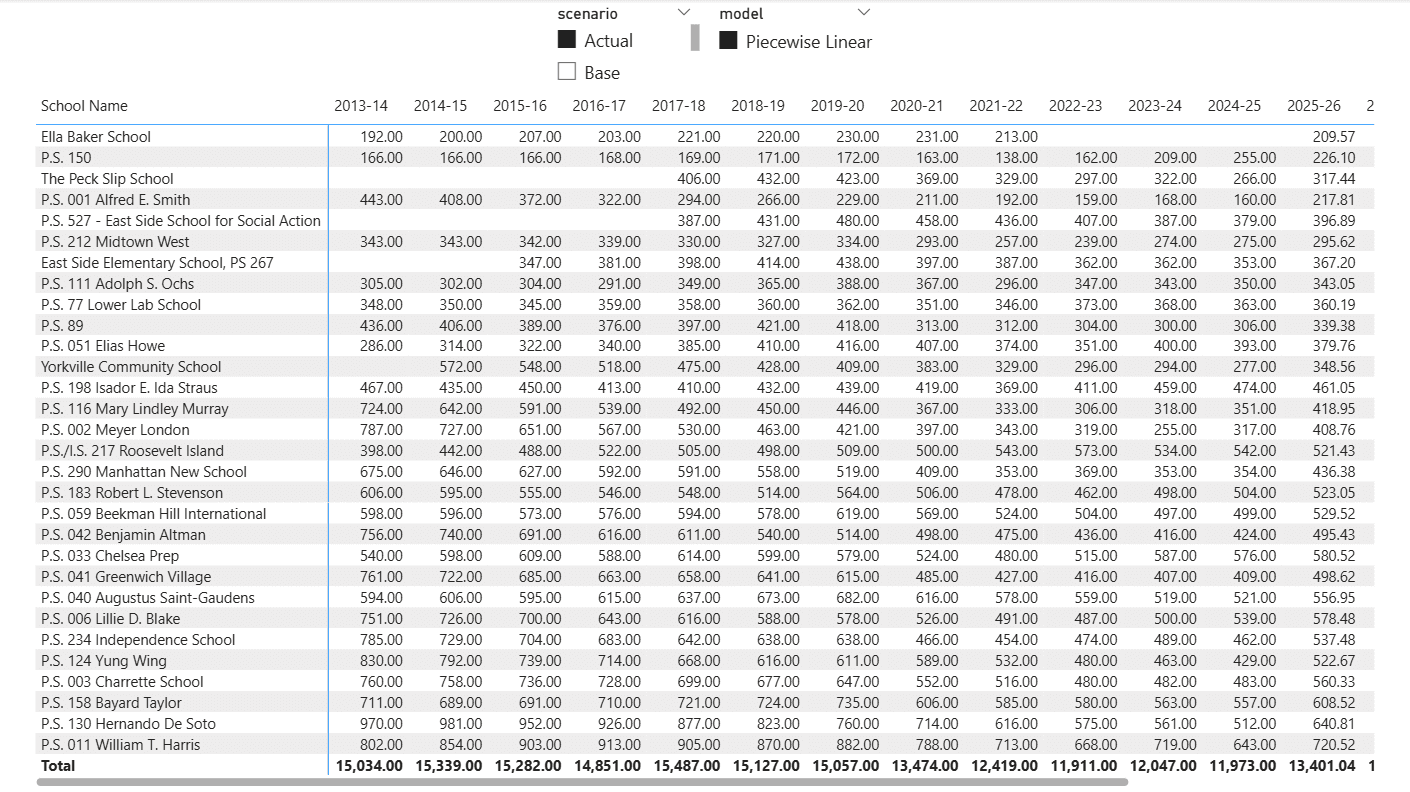
I forecast 30 NYC public elementary schools three years out, then back-tested the model once NYSED released the actuals for those years. The methodological call, three analyst-bounded scenarios over a single ML default, beat Facebook Prophet on the same data by more than 2x in MAPE.
Approach
Pre-COVID was a six-year flat plateau at ~15,800 K-5 students. COVID broke it to ~12,400. With only two post-break data points, a Prophet-style ML answer pretends to know more than the data can say.
- Stitched 12 years of NYC DOE and NYSED enrollment data and fit a piecewise linear model with a known structural break at 2020. Bounded the future with three analyst scenarios (decline, stabilization, recovery) instead of a single point forecast.
- Back-tested when NYSED published the 2022–25 actuals. The Base scenario landed at 8.71% MAPE. Prophet on the same data landed at 19.20%. The analyst-bounded approach beat the ML default by more than 2x.
- Tested the popular "wealthy catchments left first" story and refused to ship it. Pearson r = +0.14 between catchment income and enrollment decline. Lowest-income schools in Chinatown and the Lower East Side declined more than the high-income downtown catchments; the resilient outlier is Roosevelt Island (+13%), suggesting geographic friction of exit is what matters.
- Shipped a four-page Power BI dashboard: system-wide fan chart, scenario/model operational matrix, single-school drill-through, and a backtest validation page.
PythonpandasNumPystatsmodelsProphetPower BICensus ACSCensus Geocoder API
Open on GitHub